Creating a “Final” Design

I wrote my Site Assessment with great zeal and motivation. It was relatively straight forward– gather information, of all kinds; write it down. Took awhile, but then I was done. Felt done.

Then I moved into the Analysis phase with considerably more hesitation. Didn’t ever really feel like I had a handle on what exactly I was supposed to do to make sense of all the information I had gathered. I felt fairly lost in the forest of trees. But I plugged away with little lists and exercises until eventually I did start to feel like I had gotten somewhere. I finally felt ready to approach my Final Design.

I was afraid of it, though. It loomed large, with scary music in the background. Such heavy expectation.

I cut out little paper squares of all my elements, then played around with them on my base map. Since our property is small, there really weren’t many different configurations. I made up three Design Options, drew them onto overlays, and then listed their pros and cons. I spent a few weeks cogitating, until the choice became clear. Until it felt like there really wasn’t a choice, only one option was really going to work.

Then suddenly, that was it. I had just made my Final Design. All that was left was to draw out a good map, and write some details down. After months of research and consideration, the last step seemed too easy. I had spent so long gathering all the pieces, and then they had more or less fallen into place. And now it was over.

What if I had chosen wrong? What if my final design was not the “right” design for our property. So much seemed to be riding on it.

And that’s when I realized, there is no such thing as a final permaculture design. If you do it “right” it’s never finished, but always evolving. Which I found both depressing and liberating.

Permaculture is about continual observation and response. I had read it many times, but it took a long time to sink in through my very goal-oriented brain. No matter how well you study your land and elements, there is no way you could foresee everything. Even if you could, living things change and grow.

The design is not an end point, but rather a beginning. The inception of an interactive relationship with the land and garden; and a creative yet very deliberate approach to that relationship.

It has become increasingly clear to me that if I follow my design to the letter over the coming years, it will be a sure sign that I have failed to create a real permaculture. Instead I must be receptive and flexible, continually observing this place in the world and the changing needs of my family, as well as the outcome of various projects, and continually tweaking my design for better effect.

As Mollison says, “I sometimes think that the only real purpose of an initial design is to evolve some sort of plan to get one started in an otherwise confusing and complex situation… as soon as we decide to start doing, we learn how to proceed.”

I have spent the winter researching, reading, thinking, planning, reading, and re- thinking. And now, as spring approaches, it is time to stop planning and start doing. I trust I will learn how to proceed.

I have posted my design, in all it’s many (many!) parts, on a separate page. It is really more of a very long ‘thinking aloud’ session than a design proper. But do let me know if you find it interesting!

Posted in Uncategorized | Tagged , , | Leave a comment

Creating Guilds from Native Systems

20130406-081638.jpg
Artwork by Casey Cripe

I recently, finally, got down to doing an exercise I had meant to do for months– examining one of our local native ecosystems in detail and trying to imagine how it might translate into a human supporting agriculture on our property.

I chose to focus on a forest edge, since that is most what our yard resembles. I sketched out a typical grouping, and listed each element’s inputs and outputs to get an idea of their roles. This requires a pretty intimate knowledge of the local ecosystem, which I am lucky to have. In fact, the reason I hadn’t done the exercise yet in a formal way was that it had felt kind of silly and redundant. Like, I already know it, so why write it out? But like every other silly little exercise I’ve made myself do, it turned out to be so interesting and revelatory!

One thing that bugs me about guilds is that they do not include animals. I guess the idea is to focus on the plants’ relationships, but since animals are so integral to the cycles, it seems weird to me to leave them out. So, I included animals in my native ecosystem sketch.
I’m going to show you my sketch, just so that you can be inspired to try this regardless of artistic skill!!!

20130406-081747.jpg Now, since my chicken scratching is mostly illegible, here it is in list format. Note that this is an extreme simplification of an extensive ecosystem. I’m looking more at groupings and roles than specific species.

The main element is an evergreen tree, either spruce or hemlock (or many trees together– actually they don’t grow solitary here, which is an essential thing. With very shallow root systems and high winds, they must grow in groups. Naturally this area has nearly continuous forest cover, with openings and edges as occasional exceptions. But anyway, you get the idea.)

Underneath the evergreen (spruce or hemlock) are:
-blueberry bushes and a couple of other bushes which produce small seeds
-lots of ferns
-a complete ground cover of thick moss
-lots of funguses and lichens

Basic animals include:
-squirrels
-small birds
-eagles
-bears

Having listed the eagles and bear, I really couldn’t leave out salmon– which are so essential to our ecosystem. Bear travel quite large ranges, so are part of ecosystems which are not necessarily anywhere near salmon streams.

Then I listed out each element’s inputs and outputs. Most interesting about this was realizing how little I do know. Like– moss. What is that stuff for? What does it do? Holds a hell of a lot of water, and builds soil, a living mulch. That’s all I could come up with, nothing obvious eats it. Ferns too– what do they do besides providing mulch and building soil?

The berries obviously feed lots of animals who in turn distribute and sow their seeds. The evergreen trees have a fairly obvious and tight relationship with the squirrels, who likewise distribute and sow the trees seeds (as well as mushroom spores). Salmon feed bears and eagles, who leave lots of half-eaten salmon carcasses scattered throughout the woods to build more soil. Fungus underly everything and are almost exclusive decomposers in our very cold soils.

Next, I wanted to figure out how to mimic this natural system to create my food producing guild. To help me think it through, I listed out the roles elements play before thinking of the specific elements I might use. The guild resulting from this is fairly straightforward. With evergreen trees at the center, lots of berries and mushrooms underneath. Cleared areas for annual gardens and lawn providing an “edge” habitat and solar access for the berries. The animal element was a bit more of a stretch. I hope that chickens and ducks can fill the role of small songbirds, and the squirrels can stay. The most interesting part was when I got to the bear. What takes the place of bear? I wondered. What eats the berries and salmon and throws the bones up around the trees? What large omnivorous predator can take the place of– !! Of course! Humans! The whole reason for this– the true central element of a home permaculture system.

Once I started thinking about it, I realized how much humans and bears are alike. Bears eat mostly greens in the spring, then fatten up on berries and fish in the summer and fall. They happily scavenge anything else edible in between. They clomp around and scare everybody else away. Somehow it makes me inordinately happy to think that we are the bears in our little made up ecosystem. Makes me feel more like I fit here.

I highly recommend this exercise. Even if you feel like you don’t know much about the native ecosystem in your area, start writing and you might be surprised.

More guild reading:

The Treeyo Permaculture Online Reader has a nice introduction to guilds.

Gaia’s Garden by Toby Hemmenway has two chapters on guilds and offers a wonderful, thorough discussion of the subject.

MidWest Permaculture offers a nice booklet of guilds which work well in their area.

If you really want to dive deep, The Apios Institute is a growing resource of people’s actual experiences with plants for forest gardens and polycultures. (You do have to pay a membership fee to access most of the information, and since I have not done so, I can’t vouch for whether it’s worth the money. However, it is run by Eric Toensmeier, who co-wrote the two volume, highly respected Edible forest Gardens, so it’s probably pretty great.)

Posted in Uncategorized | 1 Comment

Patterning

Bill Mollison says patterning is the heart of design, and design is the heart of permaculture, so I dutifully read straight through Chapter 4 “Patterns,” even though it was a slog which took me over a month to complete. I didn’t skim it, I read every word, in fact I read most of the chapter twice, in a desperate attempt to understand. I had hoped that as I read it would start to come together, start to make sense, start to become relevant.

Sadly, it didn’t. The Manual can tend towards some heavy science, but chapter 4 is (was for me anyway) almost completely impenetrable. Looking back over the chapter now, I realize I did actually absorb some interesting and useful knowledge. More than I had felt like I did. But even still, at the end of the chapter, I couldn’t have explained what a pattern is.

I think maybe the problem is of the ‘can’t see the forest for the trees’ variety, which I am feeling lots of since I got into permaculture. Mollison attempts some awfully extreme detail, while still expecting us to keep the whole picture in mind, and I find myself panting to keep up. I can see the individual trees alright, but I can’t zoom back out to the forest. Actually, for the patterns chapter, I couldn’t see either clearly. And, while I don’t mind missing out on a few of the details, I can’t stand not understanding the basic concept.

I tried to find some outside reading that would help. Strangely, I couldn’t find too much on the old interwebs. I have to wonder if the patterning isn’t a big hole in permaculture, that only a few people really understand. Maybe the rest of us do understand it, but only in a visceral, instinctual way. Not in a clearly defined, intellectually succinct way. There were lots of sites that used the word, but very, very few that really explained what it meant.

Then I found an article titled Decoding Pattern, by Big Sky Permaculture, which helped bring everything together for me, “A pattern is essentially an ordered arrangement of objects or events in time or in space, [it] is the connections and relationship between things.” I recommend the whole article (it was supposed to be part 1 of 2, sadly there appears never to have been a 2.)

At the very end of chapter 4, in the very narrow little section on “Applications,” I did have one small epiphany. It was as he described using ‘flowforms’ (which mimic the irregular riverbed shape) to direct water for aquaculture. By applying a natural pattern to the bed through which water flows, you can achieve great oxygenation with no further effort or energy.

At that point, I thought about the way that modern humans approach everything– our dominant cultural pattern is straight lines and square corners. I thought about how we would normally construct a water channel– the modern aqueduct. We design for efficiency, but our knowledge and understanding is so limited that we only perceive a handful of variables out of the hundreds and thousands. We create an efficient pattern to suit those few variables. A straight water channel with a flat surface allows water to move efficiently over great distances. By “efficiently” we mean fast and smooth.

Natural patterns are supremely efficient though, because nature constructs things with all variables at play. Fast and smooth water is efficient at transporting large quantities of water from one place to another, but that’s all it does with efficiency. It doesn’t do anything else of particular value along the way. Natural patterns on the other hand might not do any single thing with the greatest efficiency, but they wring every last bit of random and seemingly unrelated potential out of whatever they are applied to.

Obviously that is an extraordinary quality to emulate on the homestead. However, as someone who once constructed a too-large spiral garden bed, I can safely say that human interpretation of natural patterns is highly fallible. Although the herb spiral that Mollison describes– 5 ft across and mounded up to 4 ft tall in the center– may well be brilliant, an annual vegetable bed shaped into a flat spiral 20 ft in diameter is a royal pain in the ass.

The keyhole beds so quintessential to permaculture also look to me like an inefficient pattern for much of my garden. This is another case of something which works brilliantly in one scenario and doesn’t work at all in another. If you are growing perennial crops, keyhole beds would be awesome. Or if you were growing annual crops using no-dig and heavy mulch methods, yeah, I can see it. But for a typical annual vegetable garden, dug up once/year and in great need of regular weeding/tending, keyhole beds would be another royal pain.

[The case could then be made– stop digging and start mulching. But here in Cordova our cold, wet soils make for very, very low fertility and you need to fork in amendments yearly. And sadly, you can’t apply mulch to annuals at all, it insulates the cold soil from the meager heat of the sun. The true permaculture response to this place would be to not grow annuals at all. I am simply not prepared to give up my kale and carrots.]

Blindly or simplistically applying a “natural” pattern isn’t useful at all. Nature is case sensitive to the extreme! Certain patterns are appropriate to certain functions, and size and location are everything. Which is I suppose why he spent such a long time describing patterns, we must well understand them to be able to apply them.

Sadly, I just didn’t feel his explanation was accessible, either to myself or your average aspiring permaculturist. Bill Mollison has given humanity some incredible insights, and written a mostly concise, informative and even accessible manual describing them. If he has fallen a bit short with just this one chapter, can we blame him? Can we at least admit it? Or do we have to play The Emporer’s New Clothes and everyone pretend we get it, so that we can prove our selves worthy?

A friend of mine told me I was just taking it too seriously, looking too hard. “You already get it,” she said. “Don’t over complicate it.” And maybe that’s it, I am known to over complicate things. In one of the lectures I listened to online, Mollison said that children understand pattern innately, and that we lose it as we grow up. Maybe we have natural pattern understanding driven out of us by the prevelance of modern straight/square patterning. Maybe we just have to free our minds to re-understanding what our animal selves still know….. Maybe I just need to eat some mushrooms.

Posted in Uncategorized | 3 Comments

Moving into the Design Process: Exploring Placement

After completing my detailed analysis of elements, I felt a mindblock. Where to go from there? What next? I have so enjoyed the open-ended feeling of the assessment stage, I am almost hesitant to start actually making decisions. And how to start making decisions anyway?

A few days ago, I did an exercise that turned out to be very helpful. I printed out my chart of elements and cut out each element (leaving it attached to it’s associated description, inputs, outputs and access columns.) I mentally divided our kitchen table into a giant “chart” with Zone 1, Zone 2, etc across the top, and Full Sun, Part Sun and Shade Tolerant down the side. Then I picked up each element and carefully considered where on the chart it belonged. For example, annual gardens belong in zone 2 (my zones are a bit skewed from the classic permaculture zoning because of my small yard), and full sun. Firewood storage on the other hand can be put in zone 3 and full shade.

20130123-083417.jpg

The tangible quality of arranging pieces of paper, as well as the practice of disassociating my zones and microclimates from the actual property were both very helpful. Insights were flying at me! I highly recommend this exercise.

After laying out the elements in a rough chart form, I wanted to create a graphic of the outcome. I wanted to preserve the disassociation from the actual property, to keep my mind open, so I didn’t use my previous zone and sector map but rather sketched a new one in the classic bullseye format. This is a chart really, just in a different shape. Each section represents not a specific place on our property, but rather a combination of circumstances which occurs on our property. I think the distinction is important because when I look at my actual map, I just can’t help but jump to so many conclusions based on past thoughts about it. What I’m trying to do now is free myself from those past conclusions and open my mind to new possibilities. Groovy, man.

20130123-083511.jpg

If you don’t have a printable analysis of elements, no problem. You could use mine (pdf here) though it is to some degree site specific. But this exercise could work without a pre-made analysis too, just sitting down with a simple list of elements next to a (non-map based) zone and sector chart, and then thinking carefully about each element before writing it on the chart. Be smarter than me and use a pencil.

Note that if you do start with actual pieces of paper with the elements on them, your imaginary table “chart” might track different things than mine. My sun/shade consideration is basically just distilled sectoring as it applies to my land. Here, sun is the issue, the thing in demand. There are other microclimates to consider, and I did expand my considerations a bit in the bullseye chart, but to simplify the initial tangible charting process, I used just sun considerations for a basic starting point. In a desert climate you might put water access down the side instead of sun.

After making my basic chart, and placing all the elements on it, I added one more thing– the blue lines indicate where elements have beneficial or necessary connections to each other. Relative location– one of the bases of permaculture. This did take the edge off of the brilliant simplicity of the whole exercise (I had the most useful mental energy flowing when I was at the moving pieces of paper around phase), but it had to happen really, somehow, at some point. Let me know if you come up with a more graceful solution to brainstorming relative location superimposed onto zones and sectors.

Please let me know if you try this out! I’d love to hear how it works for others.

Posted in Uncategorized | Tagged , , , , , , , | 1 Comment

Schedule

Jan. 28 — the first half of Chapter 4: Patterns, up through 4.10
Feb. 4 — the second half of Chapter 4
Feb. 11 — Chapter 6: Trees (it’s a relatively short one)
Feb. 18 — the first half of Chapter 7: Water, up through 7.3
Feb. 25 — second half of Chapter 7
March 4 — first half of Chapter 8: Soils, through 8.9
March 11 — second half of Chapter 8
March 18 through April 1– chapter of choice from those remaining (earthworks, aquaculture, and climate specific strategies)
April 1 through 15 — finalize design
April 15 — share and critique designs

Posted in Uncategorized | Leave a comment

Functional Analysis of Elements

After the site assessment and general focus stage is done, you should hopefully have a long list of desired elements. Now the fun part comes– figuring out where to put everything for optimum functioning of the design. This is the heart of permaculture, right here, and correspondingly permaculture offers up some wonderful tools for the process.

Using zoning and sectors together provides a kind of revolving wheel, narrowing placement down to a general area of your property. A list of inputs and outputs, or functional analysis for each element is the next step– finding the right relative location enables the web of relationships so crucial to a natural systems. All three of these tools require an intimate understanding of your desired elements.

I have been reading, researching and practicing gardening for many years, and have gathered in my head a pretty good general knowledge of most of the plants and other elements in my design list, but I wanted to re-examine everything from a permaculture perspective– really delve into the character of each element, with a focus on relationships and functions. I also wanted to compile all the scattered information into one place so that hopefully patterns and epiphanies would surface.

I’m honestly kind of annoyed that there isn’t a book for this part of the process. I’m imagining a reference book–a long list of all the most common elements in a permaculture design, with a few pages of good detail on each element. Wouldn’t that be so helpful? Instead we all have to reinvent the wheel.

In the absence of such a book, I have been drawing on lots of different sources, as well as my own knowledge, to build my own personalized functional analysis. And really, I suppose, this will give me a far better, deeper understanding in the end. But it’s a lot of work!

If anyone else is interested in such madness, here are some great links for researching–

First of all, Plants for a Future’s unbelievably huge plant database of over 7,000 edible species is the answer for plant elements. Although each species’ details are not thorough enough for my (granted, insatiable) appetite, they do list all the necessary basics- sun requirements, preferred soil type, hardiness, mature plant size and propagation details as well as edibility and medicinal qualities.

Temperate Climate Permaculture is another great resource– a work in progress, with dozens of plants already thoroughly detailed, a few pages of information for each. It appears to be largely based on Plants for a Future, though more detail/species.

Here’s a great chart of dynamic accumulator plants from Oregon Biodynamic Group. They also have a very handy planting chart for annual vegetables as well as perennial herbs and flowers– with seeding details, mature spacing and rooting habits for each plant. I also found their chart of soil indicator weeds quite interesting– defining my yard as solidly ‘wet, acid hardpan.’

Having given those links for detailed species research, I have to say that, although I have moved on to an analysis of each individual plant, I started with an analysis of plant groups– e.g. annual vegetables, perennial berry crops, support plants, etc. And really I think that’s all I would recommend for the average backyard permaculturist. Unless, like me, you just enjoy running information through your head for fun. Consider yourself warned– creating a functional analysis for each individual plant is an exhaustive and exhausting process.

Don’t forget the other elements! Equally important is to list out inputs and outputs for things like ‘the woodshed’ and ‘duckhouse.’ I haven’t found any source for analysis of non-plant elements, apart from the ubiquitous ‘chicken’ diagram from Mollison’s book. If you know of anything, please leave a comment! In the meantime here is my first, broad analysis (before I got in too deep listing individual plants….) I’m attaching it in PDF form,   which I just barely know how to do. I think if you click on it, it will download onto your computer. Anyone know how to share a file so that it just pops up as viewable on the web?

Functional Analysis of Elements

Posted in Uncategorized | Tagged , , | 1 Comment

Balancing Fantasy with Reality

Permaculture is self-proclaimed “positivistic.” I like that about it, it gives us a hopeful way forward in some very discouraging times. But as I’ve come along with thinking and dreaming about my own permaculture site plan, in the context of my soberingly real life, I guess I just feel like I’m hitting a bit of a wall.

It’s easy, when you read the manual, to get some seriously well fueled fantasies of “simple” sustainable living worked up in your mind. You might look around at your suburban house on a flat stretch of grass, and start envisioning your future property like this:

20121025-141417.jpg

Or at least, that’s what I’ve been doing. I did my assessment, and now I get to start the big juicy project of designing my perfect future, which looks startlingly like the above random internet “permaculture” image. Yup, I want it all– greenhouses, gardens, chickens, ducks, green roof, alternative energy, plants of every size and shape, jam packed everywhere.

The thing is, turning a regular yard into that feral Eden above represents thousands of hours of work. Or, lots of money. It’s one or the other, and I don’t have either.

I guess I feel like the “positivism” leaks a bit too far for my taste into “utopianism.” Much of the permaculture literature seems to imply a complete and total change of life. It would be appropriate to a young couple just buying a piece of land to farm, with maybe not much money but boundless time and youthful energy. They would make their design and then set out to install it over the course of a year or two. Or, a middle aged couple ready to chuck the corporate life which was sucking their souls, but had nicely lined their pocketbooks and enabled them to buy good land and pay for labour and materials. Or, any one of those “amazing” people, who just always get 12 times more done than the rest of us, happily give up all modern conveniences and don’t mind living off of nothing more than wild greens and duck eggs.

At any rate, it’s other people. I used to be one of those other people (the first and last category) but as the complexities of life and maturity crept up on me, I have been humbled into one of everyone else. And I want to figure out how to make it work, how to continue working at it, without just throwing in the towel.

I do not have even a tenth the time it would take to revolutionize my yard on a short timescale. Having done the assessment, and facing the analysis and planning stages, I can feel my brain filling with lofty ideas. There are so many wonderful things I want to do. But with two little kids, and loads of bills to pay, I simply cannot devote the time, and moreover personal energy (I am in short supply), to do all those things. Even the five year plan which I wrote out hopefully, I know in my rational brain is far too optimistic. Fifteen is more like it.

No doubt it makes sense to create a long term goal, and that goal being idealistic is what helps us strive for greatness, right? But how do you translate that gorgeous permaculture dream picture above onto a typical suburban lot with nothing more than an inefficient house on it, when you are a real person with kids and/or a job and no extra cash?

I mean, seriously, how?????

I am really digging permaculture. I’m really enjoying the synthesis of all the things I am interested in and passionate about into a single, cohesive whole, culminating in an obsessively researched master plan. And I love the focus on the positive, what we can do, rather than bemoaning the End Times. But I want more, I want permaculture to help bridge this gap between the fantasy it peddles and the reality of regular life for an average family or person. There isn’t more than a token mention of how to go about creating something big and beautiful and complex over the realistic DIY timescale of ten, fifteen or even twenty years, while you’re living in the middle of it.

The problem with idealism is not the lofty ideas themselves, it’s what they leave out. The road between here and there. When your resources are limited to a mere fraction of what is necessary, you have to recognize the fact that you cannot have it all in order to clear-headedly determine priorities: what is most important to pursue, what you will have to give up and, bearing strongly in mind that your movement on the path will be achingly slow, where do you start?

I feel like this is important right now, as we finish up assessments, before we get into the next chapter and begin the design process for our properties. Mollison doesn’t discuss this practical translation of our dreams into an overall realistic prioritization, focus and timeline for our design. But as I am finding is often the case with him, he does in fact lay out the principles– work from pattern to detail, do the least work for the greatest effect. So as we start into the design chapter, and your brain gets humming with ideas for your property, try to keep those essentials in mind.

What do you want from your land, and how much time/energy/money would that take? How much of said resources do you realistically have, and therefore what percentage of your desires are practically achievable? What will you have to say no to? Maybe make a list of the main things you want along with an estimate of their time inputs and value output, respectively, to help with these difficult questions. Then as you create your design, keep those priorities in sharp focus. Plan for the eventual realization of all your dreams, but plan out what’s going to happen in the meantime too.

I’m not sure myself what is the best way is from here to there. But I do know that if permaculture is only accessible to those people willing to quit their jobs, move to the country and give up modern
life as the rest of their culture knows it, it just ain’t gonna happen on the scale we need.

Posted in Uncategorized | Leave a comment

Researching Local Climate for Site Assessment

I have been on an internet bender lately, going way overboard in climate research for my site assessment. It’s been fun, and brain sucking. The associated post Cordova, Alaska: Location and Climate is the outcome of my research. That post has all the photos and graphs, this post is a kind of behind the scenes how-to.

First I want to make sure you all know that you don’t need to spend a million hours on research like I have done. I am an obsessive personality, on the biggest obsessive kick I’ve had in years. I am also a mama of two small children, and have been busy with some intense mothering for the last 5 years. I’m having a blast diving deeply into something completely unrelated and unlike mothering, something super intellectual to use my atrophying brain; and I’m neglecting all kinds of household duties in the meantime.

Throughout this winter, I am hoping to generate a permacultural design for my home site as detailed as this 53 page Bellevue Permaculture Design, fully 20 pages of which are site and context description. Please understand that I do not expect this out of anyone else participating in the discussion group. I am sharing mine mainly just as a way to make my ‘outcome’ feel more real to myself, not as an example of what everyone else should do. Make your site design however detailed you want it to be, use whatever time and energy you want to use.

I like that Mollison values this kind of extremely detailed research, but also and equally values ‘experiential observation.’ I’ve known people who are exclusively intuitive, never analyze anything at all, and they are every bit as effective as me with all my lists and charts and ‘efficient’ strategizing. (Maybe more. Sometimes research and analysis are just an excuse to sit on my ass, drink coffee and pretend I’m being useful.) I suspect that the most effective people, like Mollison and Fukuoka, are a dynamic combination of intuitive and analytical. Myself, I am all and only the latter. So, we all have to take what we have and go with it, right?

Everyone participating in our group should write up a description of their location and climate for the site survey, but they don’t need to be nearly so thorough. If you’d rather not do the data research, you can just describe your climate based on your own knowledge of it. That is absolutely fine. Write a few paragraphs, give us an idea of what it’s like– estimate temperature averages and describe seasonal variation. Tell us when your rainy season is and when folks generally expect frost.

However, if you have the time, energy, desire and appropriate personality type, detailed research about your climate and location could potentially be very useful to your design project, as well as your overall ‘permaculture education.’

If you are so inclined, here are a number of factors to research for your area. Look for averages or ‘means.’

-high and low temperatures by month
-first and last frost dates
-your zone
-precipitation by month
-period of complete snow cover
-typical wind patterns by season
-solar input (hours, position and angle) by month

Research Resources:

Your local Cooperative Extension Service might have many of the answers, I would check there first. Some Extension Services are very good, others (like Alaska’s) are just state sponsored advertising for chemical companies.

The USDA has a new interactive Plant Hardiness Map with more refined zones. Although it is important to know your zone, they are not as all-telling as they seem. For example, snow cover is critical in the question of whether a plant will survive cold temperatures. Other essential factors are wind and duration of cold spell.

After looking around for general climate statistics for quite awhile online, I hit the jackpot with the Western Regional Climate Center. They maintain a mind-blowing database of statistics. The site is a bit awkward to navigate– the link above doesn’t take you to the home page, but directly to the regional links page (which is hard to find from the home page). Once there, you will find the page divided into three different ways to access data. 1. The first thing on the page is a set of links which will take you to a somewhat limited list of cities, with a very comprehensive single page description of the general climate, including typical cloud cover and wind direction/speed. 2. The second thing on the page is an interactive map– zoom in to your area, very close up, and then hit ‘show station.’ They have 2800 weather stations on there, including four for my tiny little town, so make sure you choose the closest or most applicable station. (In my area, the station out by the airport, 15 miles away, gets half as much rain, and much less tempering coastal influence, than here in town.) 3. The third thing is a straightforward list. You click on your state, then find your nearest station from the list. This one appears to have fewer stations than the (newer) interactive map.

I was feeling sorry for anyone outside of the western states, when I discovered that NOAA’s National Climatic Data Center coordinates Regional Centers for all parts of the US! (Now I just feel sorry for overseas folks. Please leave a comment if you find a similar resource for your area.) Although each center operates it’s own website differently, the data available looks to be exactly the same.

Once you get to the right Regional Center, and find the page for your local weather station records, it will look like this:

20121110-081625.jpg

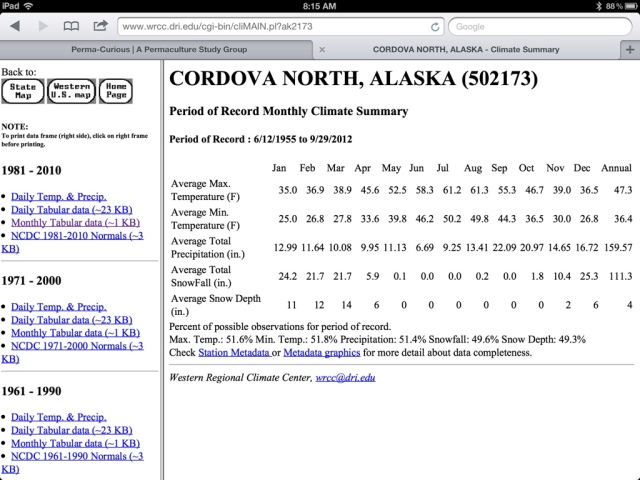
This main page is a good condensed description, but if you want to really suck your brain out on the computer, start going through that sidebar! There is so much information there you could spend days sifting through it. I particularly recommend scrolling down to Period of Record for the main Temperature and Precipitation pages, as well as the Spring and Fall Freeze Probability pages. I expect the Growing Degree Days would be very useful if I knew what that meant….

Because I found all the separate lists and tables hard to wrap my brain around, and because I’m a freak, I compiled all the loose data into a single ‘localized climate graph.’ You can see it in the Cordova Climate post. Although it did take a while, I highly recommend it for anyone with the time/inclination. It’s basically a visual representation of the growing season and climate patterns and definitely led to some ‘aha’ moments.

After I’d finished geeking out on temperature and precipitation, I wanted to get my teeth into some solar data. I thought it would be really hard to find solar information on my area, but I was wrong. Because of solar energy technology, the internet is full of some bonafide geeks and their associated ‘solar calculators.’ There were several, but this solar program from the University of Oregon (typical) was hands down the best I found. All you need to know is your zip code! You enter that (or lat/long if you are outside the US) and make any adjustments you want, then their calculator spits out an awesome curve graph, visually charting the solar path (elevation and position) for your specific location at each hour of the day, for every month of the year!

There are two distinct types of charts, one using “Cartesian” coordinates, one using “polar” coordinates. Definitely do one of each, they are both amazing visual representations. The “polar” style would lay right on top of your site map if you could print it on overlay paper.

Note: If you use your zip code to calculate, make sure to click on that option. Simply entering your zip does not automatically choose that option, as I found out when I realized I had accidentally just made myself a chart for their default location– Eugene, Oregon. Ha, ha.

One more note to any computer illiterates, because this took me hours to figure out (I’m not kidding). A good satellite image, or two or three at varying distances, will be a great asset to your survey. I wanted to pin my location on Google maps and then save the image to put into a post, but I couldn’t figure out how, partially because My Man is out of town with the computer and I am doing all this on an iPad. I finally found out what maybe everyone else and their sister already knows. On an iPad, to take a “screenshot” which will save to your photo album, press the Home button (round at bottom) and then at the same time, press the on/off button (on top.) This is so useful! Does anyone know how to take a screenshot on a computer? Knowing the term at least, you should be able to do a search for the answer…

Any other research or computer tips?

Posted in Uncategorized | 3 Comments

Cordova, Alaska: Location and Climate

20121108-134049.jpg

Cordova is a remote Alaskan fishing town, with a year round population 2,400, accessible only by ferry or plane. We are in the bullseye center of 4 very different systems– to the north we are backed by an impenetrable fortress of mountains (with peaks ranging from 3,000-10,000 feet) and a nearly contiguous glacial cover; to the east is the Copper River Delta, fanning out in a braided expanse of silty sloughs and marshes 35 miles wide– the largest intact wetlands in the United States; to the south lies the big bad Gulf of Alaska, wide open to the Pacific ocean; and to the east, the protected marine waters and old-growth rainforest of Prince William Sound, the northern end of the Cascadia bioregion.

20121110-151043.jpg

Because of this juxtaposition, we get some very intense weather. It doesn’t get near as cold and dark as the interior and northern Alaska, but neither does it ever get very warm; and sun is typically displaced by clouds and heavy rain as the surrounding mountains catch the many Pacific storms whirling by.

20121108-074759.jpg

Cordova gets an average of 160 inches of precipitation per year. That’s more than thirteen feet of water. We also get some epic storms as you can see above, with winds frequently reaching “hurricane force” (74 mph). This doesn’t leave much time or space for what anyone, anywhere would consider good gardening weather.

Although we typically have at least 130 frost-free days and often considerably more because of our coastal influence, average peak summer temperatures are between 50 and 65 degrees– and even that ‘warm weather’ rarely lasts for more than two months. Many years see weeks on end of 40-50 degrees during those supposed “peak summer months.” On top of that, the late ‘summer’ harvest months are a deluge. August receives an average of 13 inches of rain, September an average of 22 inches of rain (and temperatures of 49 degrees) and October sees 21 inches. For a little perspective, Seattle, the self-named ‘Rainy City’ gets 38 inches per year.

To create a visual representation of our typical weather systems, and make sense out of the pages of data, I assembled this chart from NOAA’s Western Regional Climate Center, weather records for Cordova’s North Station.

20121108-151101.jpg
You can see the key to the main graph at the top there, but in case you can’t read the small writing, the vertical lines are, respectively:
yellow = spring equinox
pink = typical end of continuous snow cover (my own estimation)
dark green = reliable last 28 degree frost
light green = reliable last 32 degree frost
orange = solstice
yellow = fall equinox
light green = possible first 32 degree frost
dark green = possible first 28 degree frost
pink = typical beginning of lasting snow cover

Here on the coast, we are in USDA zone 7b, with minimum winter temperatures of 0 to -5. But, I feel like this is an inaccurately high zone number because of our completely inconsistent snow cover and rapidly changing winter weather. We can have a big snow (several feet) followed by warm weather, melting all the snow into a sodden ground, followed by a temperature dive to 5 degrees and a world coated with ice. It is a very hard place for roots. And fruit trees– if they survive the frozen ground, iced and snow laden branches, and multiple false springs– are unlikely to get enough hours of sun and heat to ripen fruit.

We also get some impressive winds here, as I mentioned. It can blow very hard, gusting to 80 miles/hour or more. The storms can last for days and occur with great frequency, particularly in the fall when one right after another can produce weeks of literally constant rain. Storms typically hit from the southeast, and cold winter winds blow down from the interior north. But because of the geography of the town and our site, we tend to experience both winds from the east as they blow through the gap in the mountains (that body of water on the right is a lake, to the left a protected inlet.)

20121109-125035.jpg
Here is another view of the town, seen from across the inlet, looking east.

20121109-150652.jpg

As you can see, the tight quarters and surrounding mountains block much of the solar possibilities, particularly in winter when the angle of the sun is exceptionally low. Here is a ‘polar coordinates’ chart from the University of Oregon’s solar calculator describing the path of the sun throughout the year. NOTE: I have flipped the chart (which is created with south at the top) to correspond with the above satellite image of the town. I realize that in permacultural design we are supposed to put the ‘sunward side’ at the top, but I haven’t quite gotten my head and maps around this yet.

20121111-082923.jpg

Here is another view (Cartesian coordinates) of the same information:

20121111-083053.jpg

As you can see, here at our high latitude (61 degrees N) the sun takes a very shallow path through the sky. Even at summer solstice when we have a potential 18 hours of sunlight, the solar “azimuth” or highest point is only 54 degrees (90 degrees being straight up, or zenith). At winter solstice we get a mere 6 hours of potential sunlight, and the sun doesn’t travel higher than 12 degrees!

When reviewing the solar data for this area, it must be kept in mind how few clear days we get. I wasn’t able to find any data on the percentage of clear days for our town, but averaging between the data for two nearby towns (Valdez and Yakutat) I estimate our annual average to be 45 days clear, 55 days partly cloudy and 265 days cloudy. Clear weather is most frequent in late winter, followed by spring and early summer (my own observation). Fall and early winter are typically very cloudy, as well as rainy and windy.

In short, I am trying to garden where the world’s wettest, coldest and darkest climates intersect. It’s brilliant.

Posted in Uncategorized | 2 Comments

Creating Your Site Survey: Part 2

There was a question on the first site survey post about was whether folks were using graph paper or a computer program, and I realized I should explain a bit more about the actual mapping process.

I’m sure there are awesome landscape design programs out there and anyone who knows how is welcome to use them, in fact you could write a post here about which programs and how to. I seem to remember from the introductions that someone is a professional landscape designer… But I myself prefer plain old graph paper. I’m just an incurably old fashioned girl. Unless you are going to be using a computer program a lot, they seem not worth the time it takes to figure out how the #$&! they work, if you know what I mean.

So today I will explain the basics of mapping your garden/yard on real live paper.

First of all, if you have never done this before, you will want graph paper. It’s easy to find, kids often need it for school, so most stores carry it. The common kind has 1/4 inch squares. If you ever find a pad of smaller square graph paper, I highly recommend it. I got a pad once that has darker lines at one inch intervals, with 10 lighter lines between– I think it’s called a section pad. It’s awesome. I also found, in someone’s trash in New Orleans (I’m a hopeless scavenger) a pad of architectural drafting paper, it’s got the same small squares in groups of ten, but the pad is huge! 17 by 22 inches, exactly four times the size of a regular sheet of graph paper. So much more detail is possible. Certainly the 1/4 inch stuff works just fine, especially for this initial site survey. But if you can get hold of some drafting paper for your final site design, you should.

[Actually, I’ve just had a thought– the pad I got has many more sheets than I will ever use. If you leave a comment here asking, I will email you for your address and send you a few sheets. Seriously, it will only cost the price of a stamp. No big deal.]

But, back to the task at hand.

When you go out to take your measurements, you can just roughly sketch things in so that you have a frame of reference for your measurements, not worrying about scale. You don’t even need graph paper for that first sketch. Then, after you’ve measured everything out, copy it onto graph paper to scale. I usually count the squares across and down, and then decide how many squares to use/foot. For example, an 8 1/2 x 11 sheet of 1/4 in graph paper will be apx 34 squares by 44. For many urban lots, this works out nicely to make each square represent two feet.

If you have a large rural lot or acreage you are obviously not going to be measuring it all out with a tape measure. I believe that city offices have some kind of very basic survey map of your property/area, if you didn’t get one with the sale. Overlaying this onto a USGS topographical contour map (you can download and print free USGS maps) would be awesome, though I’m not sure how exactly you would do that… Anyone know about this? Anyway, you can look into all that over the next few months. For now, just measure your “zones 1 and 2,” the areas nearest the house and do the best you can with guessing and estimation for the rest.

One thing I forgot to stress in the last post is only to draw in permanent elements: mainly structures, but also trees and garden beds you are absolutely not open to eliminating/moving. You want your initial survey to leave as much possibility as possible. Do note the “sunward side,” south for most of us in this group– do we have any southern hemisphere participants?

So, now you should have something that looks like this:

20121101-090220.jpg

Leave off titles and description right now. You want just the bare bones for your “master copy.” Run off several copies (keeping the master separate and inviolable)– you will come back to this map many times over the next few months and will want multiple copies to sketch out existing patterns and future ideas.

For this initial site survey, you will need two copies. On one add the titles and existing non-permanent elements, so that it describes your lot exactly as it is. Don’t forget to put in undesirable realities. See “bucket hell” below. Note that I accidentally changed orientation on this copy. Don’t do that.

20121101-091413.jpg

On the other copy, draw in the immalleable external forces, such as wind direction, sun footprint, foot traffic patterns (you can change that a little with your design, but surprisingly not much), water and drainage as described in the last post, so that you have something like this:

20121101-082843.jpg

One thing I forgot to do on this one is describe the adjoining influential elements on each side, which is very important in our tight urban settings. For example, along the front of the yard is a dead end street, with a house directly across. On the north side there is a neighbors yard, with a few spruce and hemlocks between. Behind our lot is a small tract of neglected urban forest, keeping our backyard in near total shade but also deliciously private and lovely. And on the south side, there is a continuation of that forest, narrowing as it moves towards the front of the yard, as I did somewhat describe on the map itself, which also severely inhibits our sun access.

That’s it for the map. Don’t forget, it’s equally important to also describe your greater area and climate to us. Do a little research for this. What sort of ecosystem dominates the landscape? Give us some actual flora and fauna lists. What sort of weather patterns dominate each season? What is your rainfall? Frost-free days? What is your zone, and any other factors you think affect that? Details! We want ’em!

Posted in Uncategorized | 3 Comments